Market Intelligence
The Berlin real estate market in data: price trends for apartments and apartment buildings, transaction data, borough analysis – current and data-driven.
Reports
Dashboards
Insights
Market Intelligence
How We Decode Berlin's Real Estate Market
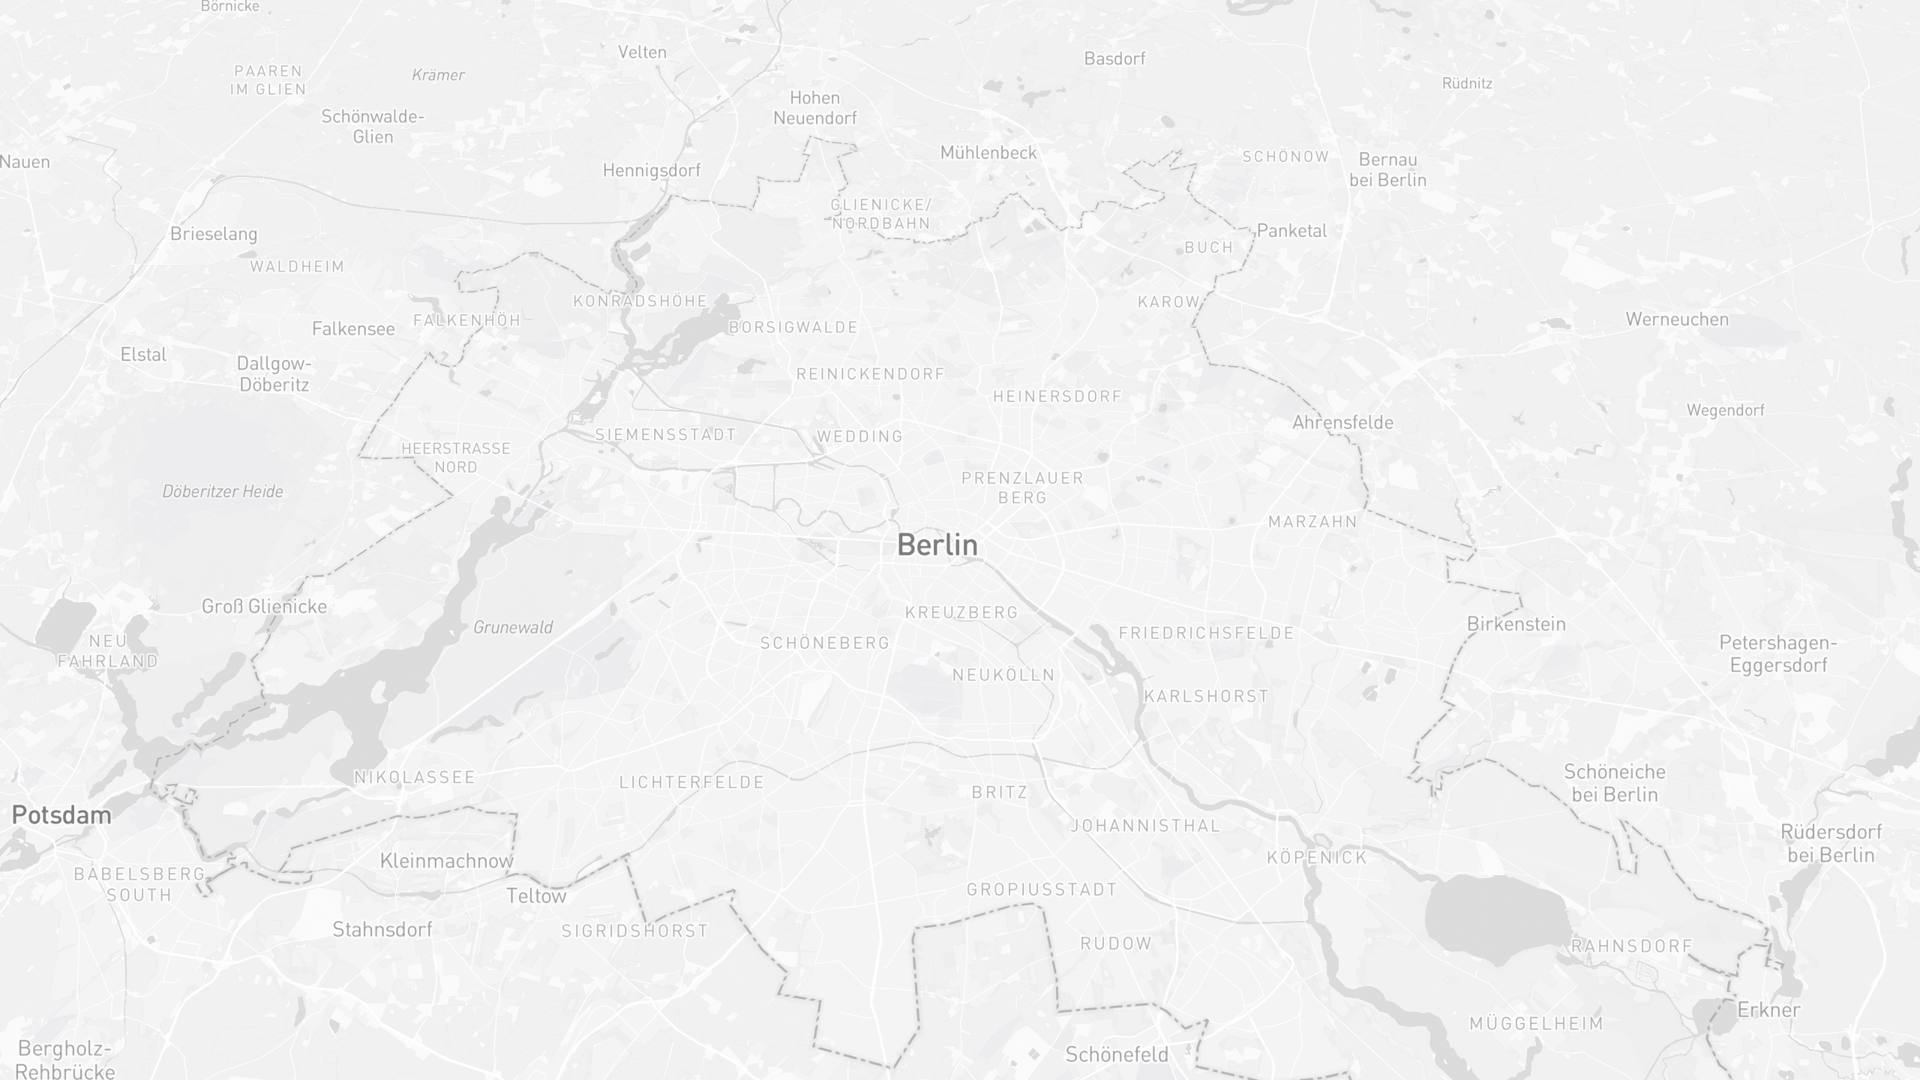
Berlin is Germany's largest transaction market for apartments and apartment buildings. Guthmann Market Intelligence offers a comprehensive view of the market's present state and development at a resolution previously unavailable. We break down the data from the citywide level to the individual building block, covering condominiums and rental apartments, apartment buildings, new construction and existing stock.
Choose the perspective that fits. Market-wide reports cover the apartment and apartment building segments. Dashboards represent the local markets of all 12 boroughs and 96 districts. Our automated valuation tool delivers an address-level assessment of a specific property.
With Market Intelligence you receive not only numbers but a complete picture for sound, well-informed decisions. The data foundation comprises quarterly transaction data, monthly-updated listings from the leading property portals, and statistical data and indices.

One report and interactive dashboards for 12 boroughs and 96 districts
Berlin Apartment Market
Whether buying or selling, the current market value of a condominium is the decisive data point. Our apartment report sets out price dynamics, demand trends and forecasts, citywide and at the level of Berlin's 96 districts.
For sellers, this enables a data-driven pricing strategy that accelerates the process and secures the best achievable price.
For buyers, the analysis provides the basis to act in line with the market and to recognise the potential of a property under consideration.
One report and interactive dashboards for 12 boroughs and 96 districts
Berlin Apartment Building Market
Berlin's apartment building market is emerging from three years of correction, set against a long preceding growth phase. Our apartment building report situates the present market and covers transaction data, prices per square metre and multiples of annual net cold rent, alongside the further criteria by which investors assess residential and mixed-use buildings in Berlin. Current developments are analysed against longer time series. Which buyer groups are active, and on what criteria do they invest?
The report serves as a basis for pricing and timing, for sellers and buyers alike.
One report with nationwide economic indicators
Macroeconomic Indicators
Alongside the fundamental housing shortage and local factors shaping Berlin's real estate market, broader influences such as inflation, mortgage rates and the political framework are key drivers.
Our macro report sets out, in concise form, the indicators and time series that bear on the Berlin real estate market. Sources include the Deutsche Bundesbank, the ECB, the Federal Statistical Office, the Federal Employment Agency, and further index providers.
Insights
Market Insights and Analysis
In-depth analyses, location portraits, and guides on the Berlin real estate market: from data-driven district reports for buyers to practical guides on buying, selling, and ownership.
Location Portraits
View all


Guide
View allNotary & Land Register
Property purchase contracts in Berlin: a secure process
Sale Taxation
The Speculation Period on German Property Sales
Costs & Tax
Costs of Buying and Selling Property in Germany
Our Services
Everything for Your Property
Resale Apartments
What's my apartment worth?
Get an initial, fast, anonymous, and valid assessment based on our extensive database and machine learning model that reveals the price you can achieve for your apartment in Berlin.
Owner-Occupiers & Investors
Buy Properties in Berlin
Find your dream home or invest with confidence in Berlin, with apartments in prime locations and apartment buildings as investment opportunities.
All Current Listings
Services
Apartment Sales in Berlin
20 years of experience. From precise valuation to successful closing – with a network that finds the right buyer.

Services
Apartment Building Sales in Berlin
Professional sale of multi-family buildings. Well-founded valuation, discreet marketing, and access to an established investor network.
Learn More
Services
Condominium Conversion Sales
Successful sale of condominium conversion. Data-driven strategies and proven sales processes for businesses and investors.
Learn More